さて、前回「IOPSのインストールと測定結果 (CentOS/ServersMan@VPS)」でServersMan@VPS のIOPS 測定を行った。ついでに、さくらインターネットのVPS (標準OSの CentOS x64)で測定したのだが、極端に遅かった。
スポンサードリンク
インストール
# yum install libaio-devel
# wget http://pkgs.repoforge.org/fio/fio-2.0.9-1.el6.rf.x86_64.rpm
# rpm -Uvh fio-2.0.9-1.el6.rf.x86_64.rpm
※環境は標準のもので、できたてほやほやのVPS に上記コマンドだけを入力したもの。「Linux www****ui.sakura.ne.jp 2.6.32-279.19.1.el6.x86_64 #1 SMP Wed Dec 19 07:05:20 UTC 2012 x86_64 x86_64 x86_64 GNU/Linux」。
※細かい話や設定ファイルの内容は前回と全く同じなので、「IOPSのインストールと測定結果 (CentOS/ServersMan@VPS)」を参照されたし。
テスト1
コマンド
# fio random-read-test.fio
測定結果1
random-read: (g=0): rw=randread, bs=4K-4K/4K-4K, ioengine=sync, iodepth=1
fio-2.0.9
Starting 1 process
random-read: Laying out IO file(s) (1 file(s) / 128MB)
Jobs: 1 (f=1): [r] [100.0% done] [11640K/0K /s] [2910 /0  iops] [eta 00m:00s]
random-read: (groupid=0, jobs=1): err= 0: pid=1394: Mon Dec 24 03:13:05 2012
  read : io=131072KB, bw=11111KB/s, iops=2777 , runt= 11797msec
    clat (usec): min=151 , max=46879 , avg=353.77, stdev=708.63
     lat (usec): min=151 , max=46879 , avg=354.24, stdev=708.64
    clat percentiles (usec):
     |  1.00th=[  185],  5.00th=[  203], 10.00th=[  215], 20.00th=[  225],
     | 30.00th=[  235], 40.00th=[  251], 50.00th=[  274], 60.00th=[  298],
     | 70.00th=[  334], 80.00th=[  406], 90.00th=[  580], 95.00th=[  692],
     | 99.00th=[  852], 99.50th=[  988], 99.90th=[ 7904], 99.95th=[15936],
     | 99.99th=[32640]
    bw (KB/s)  : min= 6472, max=12896, per=99.86%, avg=11094.96, stdev=1679.87
    lat (usec) : 250=39.17%, 500=47.02%, 750=10.91%, 1000=2.43%
    lat (msec) : 2=0.28%, 4=0.05%, 10=0.05%, 20=0.05%, 50=0.04%
  cpu          : usr=1.78%, sys=12.00%, ctx=32772, majf=0, minf=28
  IO depths    : 1=100.0%, 2=0.0%, 4=0.0%, 8=0.0%, 16=0.0%, 32=0.0%, >=64=0.0%
     submit    : 0=0.0%, 4=100.0%, 8=0.0%, 16=0.0%, 32=0.0%, 64=0.0%, >=64=0.0%
     complete  : 0=0.0%, 4=100.0%, 8=0.0%, 16=0.0%, 32=0.0%, 64=0.0%, >=64=0.0%
     issued    : total=r=32768/w=0/d=0, short=r=0/w=0/d=0

Run status group 0 (all jobs):
   READ: io=131072KB, aggrb=11110KB/s, minb=11110KB/s, maxb=11110KB/s, mint=11797msec, maxt=11797msec

Disk stats (read/write):
  vda: ios=32607/16, merge=0/6, ticks=9719/14, in_queue=9698, util=81.86%
測定結果2
random-read: (g=0): rw=randread, bs=4K-4K/4K-4K, ioengine=sync, iodepth=1
fio-2.0.9
Starting 1 process
Jobs: 1 (f=1): [r] [100.0% done] [12091K/0K /s] [3022 /0  iops] [eta 00m:00s]
random-read: (groupid=0, jobs=1): err= 0: pid=1397: Mon Dec 24 03:14:03 2012
  read : io=131072KB, bw=10941KB/s, iops=2735 , runt= 11980msec
    clat (usec): min=148 , max=36239 , avg=358.35, stdev=576.35
     lat (usec): min=149 , max=36240 , avg=358.82, stdev=576.35
    clat percentiles (usec):
     |  1.00th=[  183],  5.00th=[  203], 10.00th=[  215], 20.00th=[  227],
     | 30.00th=[  241], 40.00th=[  262], 50.00th=[  286], 60.00th=[  310],
     | 70.00th=[  346], 80.00th=[  402], 90.00th=[  548], 95.00th=[  692],
     | 99.00th=[  940], 99.50th=[ 1192], 99.90th=[ 8384], 99.95th=[14656],
     | 99.99th=[20608]
    bw (KB/s)  : min= 4157, max=12672, per=99.51%, avg=10886.83, stdev=1747.32
    lat (usec) : 250=34.60%, 500=53.03%, 750=8.95%, 1000=2.66%
    lat (msec) : 2=0.46%, 4=0.07%, 10=0.15%, 20=0.06%, 50=0.02%
  cpu          : usr=2.15%, sys=11.84%, ctx=32778, majf=0, minf=28
  IO depths    : 1=100.0%, 2=0.0%, 4=0.0%, 8=0.0%, 16=0.0%, 32=0.0%, >=64=0.0%
     submit    : 0=0.0%, 4=100.0%, 8=0.0%, 16=0.0%, 32=0.0%, 64=0.0%, >=64=0.0%
     complete  : 0=0.0%, 4=100.0%, 8=0.0%, 16=0.0%, 32=0.0%, 64=0.0%, >=64=0.0%
     issued    : total=r=32768/w=0/d=0, short=r=0/w=0/d=0

Run status group 0 (all jobs):
   READ: io=131072KB, aggrb=10940KB/s, minb=10940KB/s, maxb=10940KB/s, mint=11980msec, maxt=11980msec

Disk stats (read/write):
  vda: ios=32533/0, merge=0/0, ticks=9931/0, in_queue=9900, util=82.59%
テスト2
コマンド
# fio four-threads-randio.fio
測定結果1
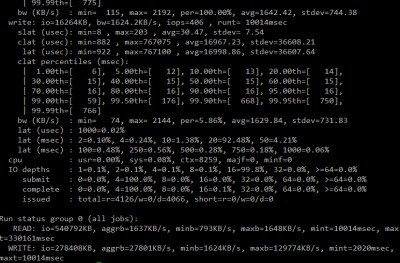
bgwriter: (g=0): rw=randwrite, bs=4K-4K/4K-4K, ioengine=libaio, iodepth=32
queryA: (g=0): rw=randread, bs=4K-4K/4K-4K, ioengine=mmap, iodepth=1
queryB: (g=0): rw=randread, bs=4K-4K/4K-4K, ioengine=mmap, iodepth=1
bgupdater: (g=0): rw=randrw, bs=4K-4K/4K-4K, ioengine=libaio, iodepth=16
fio-2.0.9
Starting 4 processes
bgwriter: Laying out IO file(s) (1 file(s) / 256MB)
queryA: Laying out IO file(s) (1 file(s) / 256MB)
queryB: Laying out IO file(s) (1 file(s) / 256MB)
bgupdater: Laying out IO file(s) (1 file(s) / 32MB)
Jobs: 1 (f=1): [_r__] [100.0% done] [1158K/0K /s] [289 /0  iops] [eta 00m:00s]
bgwriter: (groupid=0, jobs=1): err= 0: pid=1423: Mon Dec 24 03:26:53 2012
  write: io=262144KB, bw=25819KB/s, iops=6454 , runt= 10153msec
    slat (usec): min=2 , max=9807 , avg=39.01, stdev=75.17
    clat (usec): min=287 , max=521928 , avg=4912.11, stdev=17986.52
     lat (usec): min=316 , max=521940 , avg=4951.99, stdev=17985.10
    clat percentiles (usec):
     |  1.00th=[  772],  5.00th=[  964], 10.00th=[ 1096], 20.00th=[ 1288],
     | 30.00th=[ 1448], 40.00th=[ 1608], 50.00th=[ 1800], 60.00th=[ 2024],
     | 70.00th=[ 2384], 80.00th=[ 3088], 90.00th=[ 7648], 95.00th=[14784],
     | 99.00th=[117248], 99.50th=[129536], 99.90th=[154624], 99.95th=[276480],
     | 99.99th=[522240]
    bw (KB/s)  : min=  833, max=54688, per=99.57%, avg=27307.74, stdev=17858.43
    lat (usec) : 500=0.04%, 750=0.73%, 1000=5.47%
    lat (msec) : 2=52.55%, 4=25.98%, 10=6.93%, 20=5.18%, 50=1.95%
    lat (msec) : 100=0.05%, 250=1.05%, 500=0.04%, 750=0.02%
  cpu          : usr=3.74%, sys=24.60%, ctx=5438, majf=0, minf=25
  IO depths    : 1=0.1%, 2=0.1%, 4=0.1%, 8=0.1%, 16=0.1%, 32=100.0%, >=64=0.0%
     submit    : 0=0.0%, 4=100.0%, 8=0.0%, 16=0.0%, 32=0.0%, 64=0.0%, >=64=0.0%
     complete  : 0=0.0%, 4=100.0%, 8=0.0%, 16=0.0%, 32=0.1%, 64=0.0%, >=64=0.0%
     issued    : total=r=0/w=65536/d=0, short=r=0/w=0/d=0
queryA: (groupid=0, jobs=1): err= 0: pid=1424: Mon Dec 24 03:26:53 2012
  read : io=262144KB, bw=389591 B/s, iops=95 , runt=689018msec
    clat (usec): min=150 , max=710162 , avg=10374.25, stdev=12204.41
     lat (usec): min=151 , max=710163 , avg=10374.87, stdev=12204.46
    clat percentiles (usec):
     |  1.00th=[  426],  5.00th=[  756], 10.00th=[ 1144], 20.00th=[ 3088],
     | 30.00th=[ 4832], 40.00th=[ 6496], 50.00th=[ 8032], 60.00th=[ 9536],
     | 70.00th=[12224], 80.00th=[16512], 90.00th=[21376], 95.00th=[27264],
     | 99.00th=[38144], 99.50th=[42240], 99.90th=[134144], 99.95th=[181248],
     | 99.99th=[448512]
    bw (KB/s)  : min=    7, max= 1184, per=48.76%, avg=382.28, stdev=97.66
    lat (usec) : 250=0.05%, 500=2.23%, 750=2.70%, 1000=2.58%
    lat (msec) : 2=7.05%, 4=10.55%, 10=37.86%, 20=24.85%, 50=11.90%
    lat (msec) : 100=0.05%, 250=0.14%, 500=0.03%, 750=0.01%
  cpu          : usr=0.28%, sys=0.90%, ctx=131257, majf=65536, minf=31
  IO depths    : 1=100.0%, 2=0.0%, 4=0.0%, 8=0.0%, 16=0.0%, 32=0.0%, >=64=0.0%
     submit    : 0=0.0%, 4=100.0%, 8=0.0%, 16=0.0%, 32=0.0%, 64=0.0%, >=64=0.0%
     complete  : 0=0.0%, 4=100.0%, 8=0.0%, 16=0.0%, 32=0.0%, 64=0.0%, >=64=0.0%
     issued    : total=r=65536/w=0/d=0, short=r=0/w=0/d=0
queryB: (groupid=0, jobs=1): err= 0: pid=1425: Mon Dec 24 03:26:53 2012
  read : io=262144KB, bw=403056 B/s, iops=98 , runt=666000msec
    clat (usec): min=143 , max=723044 , avg=10021.62, stdev=11971.03
     lat (usec): min=144 , max=723044 , avg=10022.17, stdev=11971.02
    clat percentiles (usec):
     |  1.00th=[  282],  5.00th=[  572], 10.00th=[ 1004], 20.00th=[ 2544],
     | 30.00th=[ 4320], 40.00th=[ 6048], 50.00th=[ 7712], 60.00th=[ 9280],
     | 70.00th=[11584], 80.00th=[16192], 90.00th=[21120], 95.00th=[27264],
     | 99.00th=[38144], 99.50th=[42240], 99.90th=[136192], 99.95th=[152576],
     | 99.99th=[428032]
    bw (KB/s)  : min=    7, max= 3368, per=50.42%, avg=395.29, stdev=181.59
    lat (usec) : 250=0.66%, 500=3.24%, 750=2.81%, 1000=3.15%
    lat (msec) : 2=7.80%, 4=10.47%, 10=36.37%, 20=23.66%, 50=11.58%
    lat (msec) : 100=0.06%, 250=0.17%, 500=0.02%, 750=0.01%
  cpu          : usr=0.28%, sys=0.94%, ctx=131273, majf=65536, minf=31
  IO depths    : 1=100.0%, 2=0.0%, 4=0.0%, 8=0.0%, 16=0.0%, 32=0.0%, >=64=0.0%
     submit    : 0=0.0%, 4=100.0%, 8=0.0%, 16=0.0%, 32=0.0%, 64=0.0%, >=64=0.0%
     complete  : 0=0.0%, 4=100.0%, 8=0.0%, 16=0.0%, 32=0.0%, 64=0.0%, >=64=0.0%
     issued    : total=r=65536/w=0/d=0, short=r=0/w=0/d=0
bgupdater: (groupid=0, jobs=1): err= 0: pid=1426: Mon Dec 24 03:26:53 2012
  read : io=16456KB, bw=3473.1KB/s, iops=868 , runt=  4737msec
    slat (usec): min=4 , max=1637 , avg=44.70, stdev=79.39
    clat (usec): min=362 , max=140540 , avg=9100.51, stdev=14795.94
     lat (usec): min=393 , max=140566 , avg=9147.13, stdev=14791.88
    clat percentiles (msec):
     |  1.00th=[    3],  5.00th=[    3], 10.00th=[    4], 20.00th=[    4],
     | 30.00th=[    5], 40.00th=[    5], 50.00th=[    5], 60.00th=[    6],
     | 70.00th=[    7], 80.00th=[   10], 90.00th=[   19], 95.00th=[   27],
     | 99.00th=[  119], 99.50th=[  133], 99.90th=[  139], 99.95th=[  141],
     | 99.99th=[  141]
    bw (KB/s)  : min= 1557, max= 4706, per=100.00%, avg=3453.44, stdev=1136.01
  write: io=16312KB, bw=3443.6KB/s, iops=860 , runt=  4737msec
    slat (usec): min=10 , max=2142 , avg=49.51, stdev=91.17
    clat (usec): min=176 , max=138249 , avg=8826.78, stdev=13535.06
     lat (usec): min=218 , max=138288 , avg=8878.25, stdev=13531.61
    clat percentiles (msec):
     |  1.00th=[    3],  5.00th=[    4], 10.00th=[    4], 20.00th=[    4],
     | 30.00th=[    5], 40.00th=[    5], 50.00th=[    5], 60.00th=[    6],
     | 70.00th=[    7], 80.00th=[   10], 90.00th=[   18], 95.00th=[   25],
     | 99.00th=[   55], 99.50th=[  131], 99.90th=[  139], 99.95th=[  139],
     | 99.99th=[  139]
    bw (KB/s)  : min= 1250, max= 5192, per=12.46%, avg=3416.67, stdev=1332.78
    lat (usec) : 250=0.01%, 500=0.01%, 750=0.02%, 1000=0.02%
    lat (msec) : 2=0.27%, 4=27.66%, 10=52.21%, 20=11.91%, 50=6.73%
    lat (msec) : 100=0.17%, 250=0.98%
  cpu          : usr=2.41%, sys=11.25%, ctx=9318, majf=0, minf=27
  IO depths    : 1=0.1%, 2=0.1%, 4=0.1%, 8=0.1%, 16=99.8%, 32=0.0%, >=64=0.0%
     submit    : 0=0.0%, 4=100.0%, 8=0.0%, 16=0.0%, 32=0.0%, 64=0.0%, >=64=0.0%
     complete  : 0=0.0%, 4=100.0%, 8=0.0%, 16=0.1%, 32=0.0%, 64=0.0%, >=64=0.0%
     issued    : total=r=4114/w=4078/d=0, short=r=0/w=0/d=0

Run status group 0 (all jobs):
   READ: io=540744KB, aggrb=784KB/s, minb=380KB/s, maxb=3473KB/s, mint=4737msec, maxt=689018msec
  WRITE: io=278456KB, aggrb=27425KB/s, minb=3443KB/s, maxb=25819KB/s, mint=4737msec, maxt=10153msec

Disk stats (read/write):
  vda: ios=135110/69691, merge=0/622, ticks=1351553/316171, in_queue=1667442, util=99.89%
測定結果2
bgwriter: (g=0): rw=randwrite, bs=4K-4K/4K-4K, ioengine=libaio, iodepth=32
queryA: (g=0): rw=randread, bs=4K-4K/4K-4K, ioengine=mmap, iodepth=1
queryB: (g=0): rw=randread, bs=4K-4K/4K-4K, ioengine=mmap, iodepth=1
bgupdater: (g=0): rw=randrw, bs=4K-4K/4K-4K, ioengine=libaio, iodepth=16
fio-2.0.9
Starting 4 processes
Jobs: 4 (f=4): [wrrm] [0.1% done] [1578K/12291K /s] [394 /3072  iops] [eta 01h:10m:26sJobs: 4 (f=4): [wrrm] [0.1% done] [1286K/12391K /s] [321 /3097  iops] [eta 01h:12m:46sJobs: 4 (f=4): [wrrm] [0.2% done] [2889K/20683K /s] [722 /5170  iops] [eta 54m:32s]   Jobs: 1 (f=1): [__r_] [100.0% done] [2385K/0K /s] [596 /0  iops] [eta 00m:00s]
bgwriter: (groupid=0, jobs=1): err= 0: pid=1431: Mon Dec 24 03:36:43 2012
  write: io=262144KB, bw=27825KB/s, iops=6956 , runt=  9421msec
    slat (usec): min=0 , max=6130 , avg=27.83, stdev=44.92
    clat (usec): min=146 , max=292145 , avg=4566.90, stdev=15784.40
     lat (usec): min=177 , max=292157 , avg=4595.71, stdev=15783.96
    clat percentiles (usec):
     |  1.00th=[  628],  5.00th=[  788], 10.00th=[  892], 20.00th=[ 1048],
     | 30.00th=[ 1192], 40.00th=[ 1368], 50.00th=[ 1528], 60.00th=[ 1720],
     | 70.00th=[ 2008], 80.00th=[ 2704], 90.00th=[ 7072], 95.00th=[18048],
     | 99.00th=[56576], 99.50th=[88576], 99.90th=[280576], 99.95th=[284672],
     | 99.99th=[292864]
    bw (KB/s)  : min= 8532, max=68688, per=89.42%, avg=26426.06, stdev=17332.77
    lat (usec) : 250=0.02%, 500=0.24%, 750=3.19%, 1000=13.40%
    lat (msec) : 2=52.77%, 4=16.60%, 10=5.38%, 20=3.97%, 50=3.23%
    lat (msec) : 100=0.74%, 250=0.31%, 500=0.15%
  cpu          : usr=5.01%, sys=20.73%, ctx=2661, majf=0, minf=26
  IO depths    : 1=0.1%, 2=0.1%, 4=0.1%, 8=0.1%, 16=0.1%, 32=100.0%, >=64=0.0%
     submit    : 0=0.0%, 4=100.0%, 8=0.0%, 16=0.0%, 32=0.0%, 64=0.0%, >=64=0.0%
     complete  : 0=0.0%, 4=100.0%, 8=0.0%, 16=0.0%, 32=0.1%, 64=0.0%, >=64=0.0%
     issued    : total=r=0/w=65536/d=0, short=r=0/w=0/d=0
queryA: (groupid=0, jobs=1): err= 0: pid=1432: Mon Dec 24 03:36:43 2012
  read : io=262144KB, bw=474347 B/s, iops=115 , runt=565905msec
    clat (usec): min=227 , max=650228 , avg=8496.69, stdev=11139.10
     lat (usec): min=228 , max=650228 , avg=8497.27, stdev=11139.09
    clat percentiles (usec):
     |  1.00th=[  390],  5.00th=[  474], 10.00th=[  636], 20.00th=[ 2256],
     | 30.00th=[ 3792], 40.00th=[ 5216], 50.00th=[ 6624], 60.00th=[ 7968],
     | 70.00th=[ 9280], 80.00th=[11968], 90.00th=[18304], 95.00th=[23168],
     | 99.00th=[36608], 99.50th=[42240], 99.90th=[138240], 99.95th=[150528],
     | 99.99th=[292864]
    bw (KB/s)  : min=    7, max= 1526, per=48.82%, avg=465.75, stdev=191.30
    lat (usec) : 250=0.01%, 500=6.24%, 750=4.75%, 1000=2.05%
    lat (msec) : 2=5.57%, 4=12.86%, 10=43.75%, 20=16.99%, 50=7.49%
    lat (msec) : 100=0.08%, 250=0.17%, 500=0.03%, 750=0.01%
  cpu          : usr=0.24%, sys=1.12%, ctx=131473, majf=65536, minf=31
  IO depths    : 1=100.0%, 2=0.0%, 4=0.0%, 8=0.0%, 16=0.0%, 32=0.0%, >=64=0.0%
     submit    : 0=0.0%, 4=100.0%, 8=0.0%, 16=0.0%, 32=0.0%, 64=0.0%, >=64=0.0%
     complete  : 0=0.0%, 4=100.0%, 8=0.0%, 16=0.0%, 32=0.0%, 64=0.0%, >=64=0.0%
     issued    : total=r=65536/w=0/d=0, short=r=0/w=0/d=0
queryB: (groupid=0, jobs=1): err= 0: pid=1433: Mon Dec 24 03:36:43 2012
  read : io=262144KB, bw=473665 B/s, iops=115 , runt=566719msec
    clat (usec): min=258 , max=655015 , avg=8507.93, stdev=11379.14
     lat (usec): min=258 , max=655015 , avg=8508.48, stdev=11379.14
    clat percentiles (usec):
     |  1.00th=[  390],  5.00th=[  474], 10.00th=[  628], 20.00th=[ 2288],
     | 30.00th=[ 3760], 40.00th=[ 5152], 50.00th=[ 6624], 60.00th=[ 7968],
     | 70.00th=[ 9280], 80.00th=[11968], 90.00th=[18304], 95.00th=[23424],
     | 99.00th=[37120], 99.50th=[42240], 99.90th=[134144], 99.95th=[156672],
     | 99.99th=[292864]
    bw (KB/s)  : min=    6, max= 2629, per=48.79%, avg=465.43, stdev=198.02
    lat (usec) : 500=6.28%, 750=4.79%, 1000=2.08%
    lat (msec) : 2=5.33%, 4=13.12%, 10=43.43%, 20=17.12%, 50=7.57%
    lat (msec) : 100=0.08%, 250=0.16%, 500=0.03%, 750=0.01%
  cpu          : usr=0.26%, sys=1.10%, ctx=131463, majf=65536, minf=31
  IO depths    : 1=100.0%, 2=0.0%, 4=0.0%, 8=0.0%, 16=0.0%, 32=0.0%, >=64=0.0%
     submit    : 0=0.0%, 4=100.0%, 8=0.0%, 16=0.0%, 32=0.0%, 64=0.0%, >=64=0.0%
     complete  : 0=0.0%, 4=100.0%, 8=0.0%, 16=0.0%, 32=0.0%, 64=0.0%, >=64=0.0%
     issued    : total=r=65536/w=0/d=0, short=r=0/w=0/d=0
bgupdater: (groupid=0, jobs=1): err= 0: pid=1434: Mon Dec 24 03:36:43 2012
  read : io=16484KB, bw=2700.6KB/s, iops=675 , runt=  6104msec
    slat (usec): min=5 , max=1983 , avg=37.26, stdev=52.60
    clat (usec): min=404 , max=273265 , avg=14287.68, stdev=26603.01
     lat (usec): min=424 , max=273300 , avg=14326.16, stdev=26602.76
    clat percentiles (usec):
     |  1.00th=[ 1272],  5.00th=[ 2064], 10.00th=[ 2448], 20.00th=[ 2800],
     | 30.00th=[ 3056], 40.00th=[ 3376], 50.00th=[ 3856], 60.00th=[ 5280],
     | 70.00th=[10176], 80.00th=[18560], 90.00th=[34560], 95.00th=[62720],
     | 99.00th=[140288], 99.50th=[183296], 99.90th=[252928], 99.95th=[252928],
     | 99.99th=[272384]
    bw (KB/s)  : min=  931, max= 5812, per=100.00%, avg=2663.00, stdev=1826.84
  write: io=16284KB, bw=2667.8KB/s, iops=666 , runt=  6104msec
    slat (usec): min=6 , max=2095 , avg=42.07, stdev=58.90
    clat (usec): min=239 , max=214209 , avg=9078.33, stdev=17322.60
     lat (usec): min=300 , max=214235 , avg=9121.64, stdev=17321.64
    clat percentiles (usec):
     |  1.00th=[  932],  5.00th=[ 1624], 10.00th=[ 2024], 20.00th=[ 2448],
     | 30.00th=[ 2736], 40.00th=[ 2992], 50.00th=[ 3312], 60.00th=[ 3824],
     | 70.00th=[ 5472], 80.00th=[10688], 90.00th=[21120], 95.00th=[33536],
     | 99.00th=[86528], 99.50th=[118272], 99.90th=[207872], 99.95th=[214016],
     | 99.99th=[214016]
    bw (KB/s)  : min= 1020, max= 5628, per=8.81%, avg=2604.27, stdev=1785.69
    lat (usec) : 250=0.01%, 500=0.09%, 750=0.29%, 1000=0.48%
    lat (msec) : 2=6.12%, 4=49.80%, 10=17.74%, 20=10.30%, 50=10.28%
    lat (msec) : 100=3.41%, 250=1.43%, 500=0.06%
  cpu          : usr=2.24%, sys=9.95%, ctx=9155, majf=0, minf=28
  IO depths    : 1=0.1%, 2=0.1%, 4=0.1%, 8=0.1%, 16=99.8%, 32=0.0%, >=64=0.0%
     submit    : 0=0.0%, 4=100.0%, 8=0.0%, 16=0.0%, 32=0.0%, 64=0.0%, >=64=0.0%
     complete  : 0=0.0%, 4=100.0%, 8=0.0%, 16=0.1%, 32=0.0%, 64=0.0%, >=64=0.0%
     issued    : total=r=4121/w=4071/d=0, short=r=0/w=0/d=0

Run status group 0 (all jobs):
   READ: io=540772KB, aggrb=954KB/s, minb=462KB/s, maxb=2700KB/s, mint=6104msec, maxt=566719msec
  WRITE: io=278428KB, aggrb=29553KB/s, minb=2667KB/s, maxb=27825KB/s, mint=6104msec, maxt=9421msec

Disk stats (read/write):
  vda: ios=135179/69654, merge=0/9, ticks=1159002/294416, in_queue=1453171, util=99.92%
何故遅いのか
時間帯によるものか
前回のServersMan@VPS を測定したのは、2012/12/23 (日) 午後22 時ごろだったと記憶している。日曜ということで空いているだろうが、それでもアクセスの多い時間帯ではある。
今回のさくらインターネットのVPS を測定したのは、「2012/12/24 (月) 午前3時23分」(休日)だった。ServersMan@VPS より空いている時間帯であるが、全体的にバックアップなどが動作する時間かもしれないと考えて、数時間おきに何度かテストしたが、結果は変わらず、IOPS は200 に制限されていると感じた。
使用期間中の制限なのか
知る限り試用期間中の制限項目にはなかったが、改めて確認した。やはり、明記されたリストにはない。
Q: 「さくらのVPS」のお試し期間中に制限はありますか?
A: 対象サービス : さくらのVPS全プラン さくらのVPSでは、2週間のお試し期間中、以下の機能制限がございます。
- OP25B設定 メール送信用のポート番号となる外向きの25番ポートを閉じた設定でのご提供です。
- 転送量制限 サーバからの発信(Outgoing)についてデータ転送帯域を「2Mbps」に制限します。
- ネームサーバの利用 ネームサーバサービスの利用が制限されています。
(「[001401-3]「さくらのVPS」のお試し期間中に制限はありますか? | FAQ Search – さくらインターネット」より引用)
本来はどれくらいなのか
前回の参考文献で出てきたのはさくらインターネットVPS の1G SSD プランだった。今回は1G だが、SSD プランではない。ただ、参考文献に書かれたテスト結果は、以下のさくらインターネットの明記する値と同じ結果になっている。ということは、そこに比較として明記されているVPS のハードディスクのIOPS 値を参考値とすることはできるだろう。
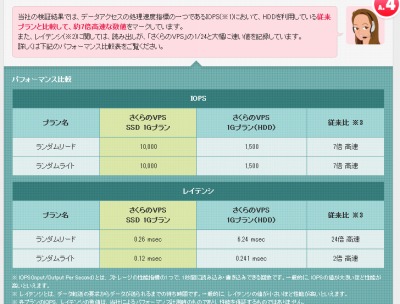
「SSDプランのメリット | さくらのVPS(仮想専用サーバ)」より。
これによれば、1,500 となっている。しかし、今回の試験では200 だった。
なお、テストには2つのバージョンのfio を利用したが、特に差はなかった。
やはり制限値なのか
さくらインターネットでは、クラウドサービスも提供している。このクラウドについては、初期にディスク周りの問題が顕著にあわられ、一時無償提供される事態となった。
VPS ではないが、クラウドの資料には、200 程度と記載されている部分がある。どうも200 という値が偶然の合致とは思えない部分もあったりなかったり。
シーク時間はシーク範囲によって異なりますが、仮に 5ms とした場合、並列でI/Oを出せない IDE では 200 IOPS が限界となります。(「さくらのクラウド、virtio対応につきまして | さくらのクラウドニュース」より引用)
聞いてみる
この手のサポートに恵まれたことはないのでまったく期待しないが、一応、サポートに聞いてみることにした。現在、返信を待っている。
コメント